Scripts
We have also provided standalone scripts for splicing and productivity analysis of quantified isoforms from flair-collapse output.
predictProductivity.py
Annotated start codons from the annotation are used to identify the
longest ORF for each isoform for predicting isoform productivity.
Requires three arguments to classify isoforms according to productivity:
(1) isoforms in psl or bed format, (2) gtf genome
annotation, (3) fasta genome sequences. Bedtools must be in your
$PATH for predictProductivity.py to run properly.
Usage:
python predictProductivity.py -i <isoforms.bed>|<isoforms.psl> -g annotation.gtf -f genome.fa --longestORF > productivity.bed
Outputs a bed file with either the values PRO (productive), PTC
(premature termination codon, i.e. unproductive), NGO (no start
codon), or NST (has start codon but no stop codon) appended to the
end of the isoform name. When isoforms are visualized in the UCSC genome
browser or IGV, the isoforms will be colored accordingly and have
thicker exons to denote the coding region.
mark_intron_retention.py
Requires three positional arguments to identify intron retentions in
isoforms: (1) a psl of isoforms, (2) psl output filename, (3)
txt output filename for coordinates of introns found.
Usage:
python mark_intron_retention.py <isoforms.psl>|<isoforms.bed> out_isoforms.psl out_coords.txt
Outputs (1) an extended psl with an additional column containing
either values 0 or 1 classifying the isoform as either spliced or
intron-retaining, respectively; (2) txt file of intron retentions
with format isoform name chromosome intron 5' coordinate
intron 3' coordinate. Note: A psl or bed file with more additional
columns will not be displayed in the genome browser, but can be
displayed in IGV.
diff_iso_usage.py
Requires four positional arguments to identify and calculate
significance of alternative isoform usage between two samples using
Fisher’s exact tests: (1) counts_matrix.tsv from flair-quantify, (2) the
name of the column of the first sample, (3) the name of the column of
the second sample, (4) txt output filename containing the p-value
associated with differential isoform usage for each isoform. The more
differentially used the isoforms are between the first and second
condition, the lower the p-value.
Usage:
python diff_iso_usage.py counts_matrix.tsv colname1 colname2 diff_isos.txt
Output file format columns are as follows: gene name
isoform name p-value sample1 isoform count
sample2 isoform count
sample1 alternative isoforms for gene count
sample2 alternative isoforms for gene count
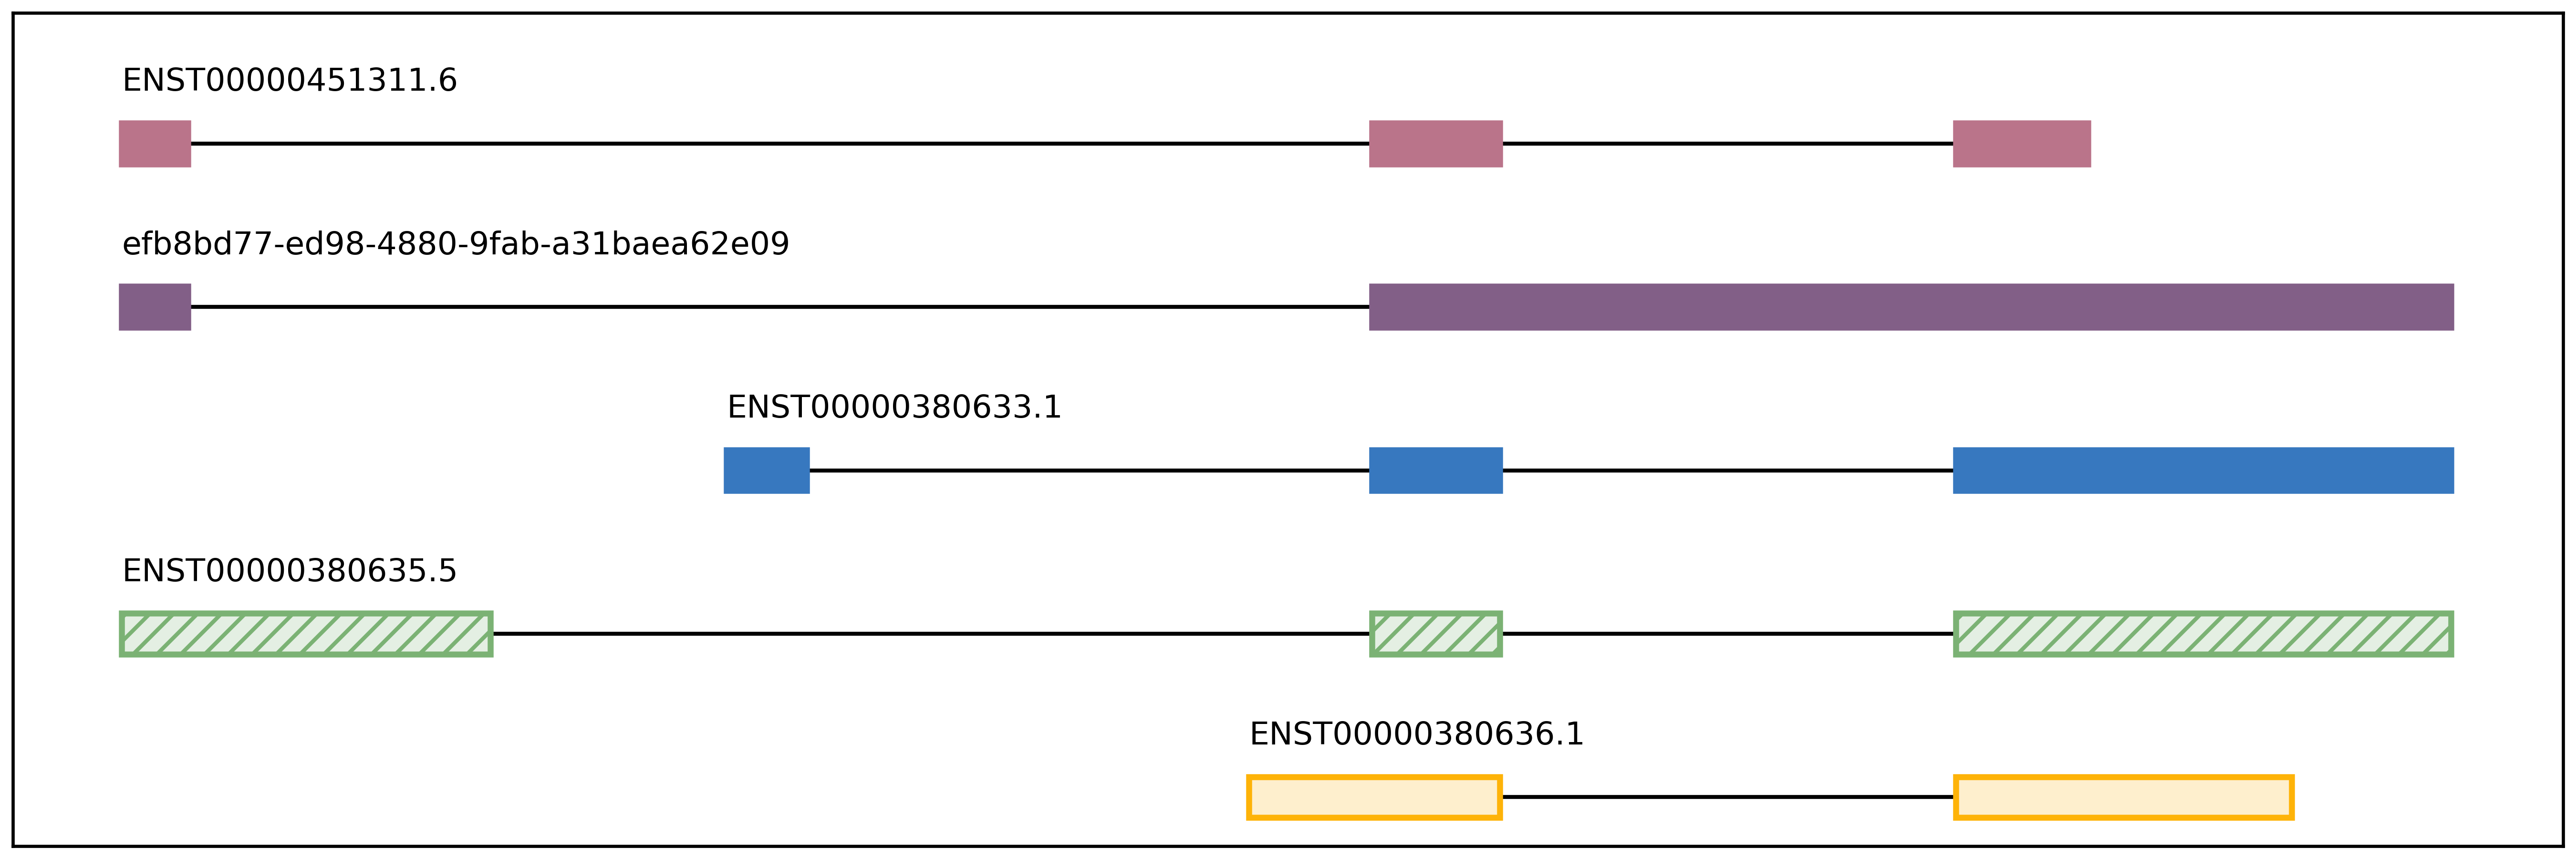
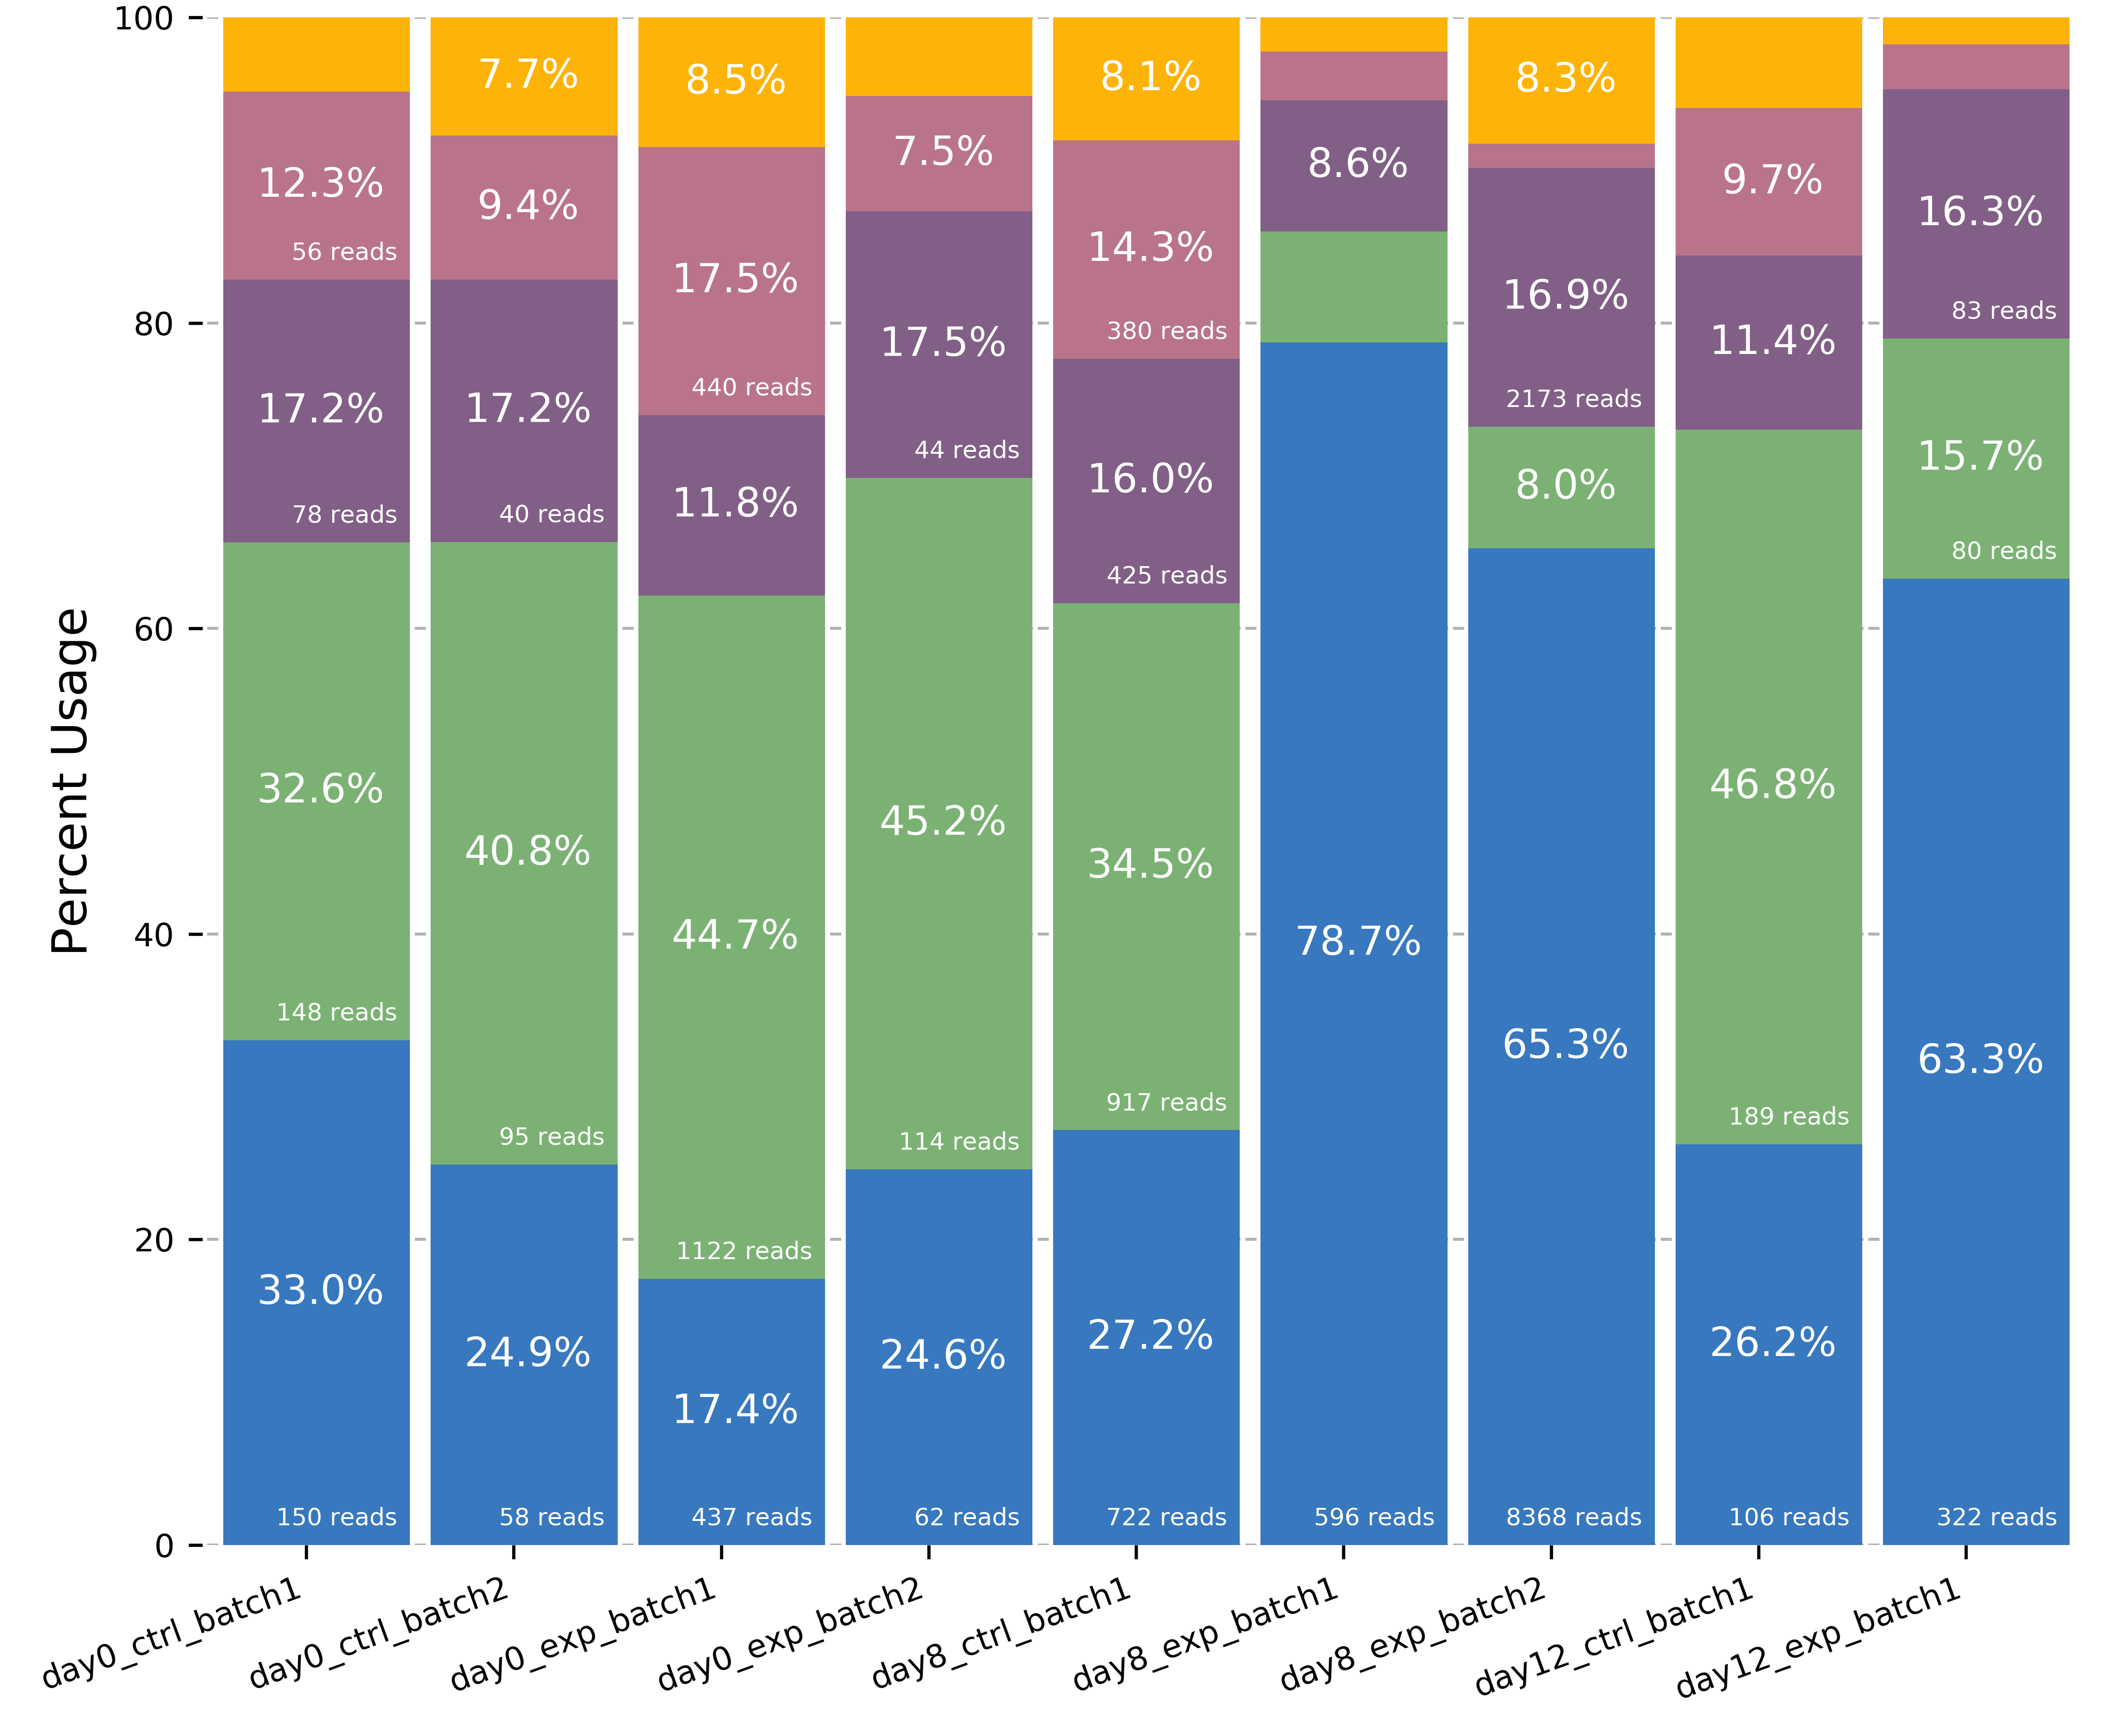
plot_isoform_usage.py
Visualization script for FLAIR isoform structures and the percent usage
of each isoform in each sample for a given gene. If you supply the
isoforms.bed file from running predictProductivity.py, then isoforms
will be filled according to the predicted productivity (solid for
PRO, hatched for PTC, faded for NGO or NST). The gene
name supplied should correspond to a gene name in your isoform file and
counts file.
Usage:
python plot_isoform_usage.py <isoforms.psl>|<isoforms.bed> counts_matrix.tsv gene_name
Outputs (1) gene_name_isoforms.png of isoform structures and (2) gene_name_usage.png of isoform usage by sample.
For example:
diffsplice_fishers_exact.py
Identifies and calculates the significance of alternative splicing
events between two samples without replicates using Fisher’s exact
tests. Requires four positional arguments: (1) flair-diffSplice tsv
of alternative splicing calls for a splicing event type, (2) the name of
the column of the first sample, (3) the name of the column of the second
sample, and (4) tsv output filename containing the p-values from
Fisher’s exact tests of each event.
Usage:
python diffsplice_fishers_exact.py events.quant.tsv colname1 colname2 out.fishers.tsv
The output file contains the original columns with an additional column containing the p-values appended.